Institute of Natural Resource Sustainability
University of Illinois at Urbana-Champaign
Illinois State Climatologist Office
Jim Angel, state climatologist
Heavy Rains in March Cause Flooding in Southern Illinois
Jim Angel, state climatologistUpdate: Press release on March precipitation issued April 3, 2008.
While northern Illinois received more snow in March, southern Illinois received heavy rain that resulted in significant flooding. Rainfall totals in southern Illinois, south of Interstate 70, generally exceeded 6 inches in March and amounts over 10 inches were very common, according to State Climatologist Jim Angel of the Illinois State Water Survey (http://www.isws.illinois.edu), a division of the Illinois Department of Natural Resources.
The two largest observed monthly totals came from Anna with 15.51 inches of rain and Fairfield with 11.91 inches. Regional rainfall totals were impressive.
For southwestern Illinois, this was the third wettest March on record with 9.47 inches. Southeastern Illinois experienced its fourth wettest March on record with 10.47 inches. On the other extreme, Yorkville, near Chicago, reported only 0.92 inches–reflecting the strong variation in precipitation across the state.
Statewide precipitation in March was 4.48 inches, 1.27 inches above normal. Snowfall was common throughout the state in March. However, the heavier amounts were limited to the northern part of the state with amounts of six inches or more along the Illinois/Wisconsin border. Antioch reported 16 inches of snow, bringing their seasonal total to 95.4 inches. This is their second snowiest winter since 1978-1979 when they received 105.1 inches.
Statewide temperatures averaged 38.4 degrees, 2.7 degrees below normal. Belleville reported the highest temperature in the state, 77 degrees on March 2, while Elizabeth reported the lowest, -2 on March 8.
The National Weather Service forecast for the next two weeks and their outlook for the month of April suggest that wetter than normal conditions will continue, especially in southern Illinois. As a result, they are calling for ongoing localized river flooding through at least mid-April across the state. Their soil moisture outlook for the next two weeks shows some drying in northern Illinois. However, soils will remain extremely wet in southern Illinois.
"This forecast indicates that we will have continued flooding problems in southern Illinois and soon planting delays will become a concern," says Angel.
March 17-19, 2008 Rainfall
A storm system moving slowly through southern Illinois from March 17-19 produced rainfall totals that exceeded 8 inches in many places south of Interstate 70 in Illinois. A site near Anna reported 11.96 inches, an amount that exceeds the 100-year storm event. Here is information on the events, including maps and data. Here is the llinois State Water Survey press release briefly describing the March 17-19 rains.
One of the challenges of this storm was the lack of actual precipitation measurements in far southern Illinois. We are always looking for weather observers for the National Weather Service cooperative network and for the new volunteer-driven Community Collaborative Rain, Hail, and Snow (CoCoRaHS) network. To find out more about this program and to look at rainfall maps and tables, visit http://www.cocorahs.org/.
Precipitation totals for the March 17-20, 2008, period.
National Weather Service cooperative observers

Station                                    Percent
 ID                          Precipitation  Avail
Number Name                      Obs        Data
---------------------------------------------------
112353 Dixon Springs Research    9.23        100
110510 BELLEVILLE_SIU_RESEARCH   5.25         75
111166 CAIRO_3_N                 5.92        100
111265 CARBONDALE_SEWAGE_PLANT   8.54        100
111290 CARLYLE_RESERVOIR         5.37        100
111386 CENTRALIA                 5.97         75
111491 CHESTER                   6.25        100
113580 GRAND_CHAIN_DAM_53        7.66        100
113595 GRAND_TOWER_2_N           6.59        100
114629 KASKASKIA_RIV_NAV_LOCK    5.39        100
114991 LEBANON                   5.55        100
115983 MURPHYSBORO_2_SW          6.94         75
116011 NASHVILLE_4_NE            2.16         75
116973 PRAIRIE_DUROCHER          5.80         75
117157 RED_BUD_5_SE              5.59         75
118147 SPARTA_1_W                6.15         50
118248 STEELEVILLE               5.87         50
119002 WATERLOO                  5.92        100
110993 BROOKPORT_DAM_52          4.66        100
112344 DIX                       6.28        100
112931 FAIRFIELD_RADIO_WFIW      5.76         75
113612 GRAYVILLE                 6.18        100
115943 MT_VERNON_3_NE            5.70        100
116874 PLUMFIELD                 6.87        100
118020 SMITHLAND_LOCK_&_DAM      4.75        100
118932 WALTONVILLE               5.62         75


Collaborative Community Rain, Hail, Snow network
volunteers with standard training and standard 4" raingages

IL-UN-3     Anna 3.1 NNE                        11.96
IL-WM-1     Marion 1.9 W                        8.90
IL-GL-1     Ridgway 3.8 NE                      8.67
IL-JK-2     Carbondale 0.8 NNE                  8.05
IL-WM-4     Bush 2.0 ESE                        7.69
IL-WM-3     Hurst 0.2 SSE                       6.96
IL-FK-2     Benton 5.3 NNE                      6.58
IL-RH-5     Chester 1.9 SSE                     6.45
IL-SC-6     Freeburg 2.0 SE                     6.38
IL-EW-1     Grayville 1.1 N                     6.18
IL-RH-7     Sparta 1.6 SW                       6.07
IL-JF-2     Waltonville 3.4 WSW                 6.02
IL-WY-1     Cisne 4.0 E                         5.97
IL-BD-1     Greenville 3.0 NNW                  5.80
IL-RH-8     Sparta 1.9 SSW                      5.78
IL-SC-1     Mascoutah 0.5 WSW                   5.62
IL-LW-2     St. Francisville 2.3 NNW            5.36
IL-RH-1     Red Bud 0.5 S                       5.36
IL-RC-1     Olney 0.4 SE                        5.30
IL-LW-3     Lawrenceville 1.4 W                 5.25
IL-LW-1     Lawrenceville 0.7 S                 4.99
IL-CT-2     New Baden 0.6 NE                    4.94
IL-SC-9     Belleville 4.5 WNW                  4.74
IL-SC-7     O'Fallon 2.5 NE                     4.73
IL-MD-16    Highland 4.7 WSW                    4.46
IL-MD-10    Granite City 1.4 ENE                4.31
IL-JS-2     Montrose 3.7 E                      4.00
IL-EF-1     Effingham 3.9 WSW                   3.64
IL-MD-8     Wood River 0.5 NW                   3.41
IL-MD-5     Alton 4.3 N                         3.03
Maps
Click on the maps to enlarge
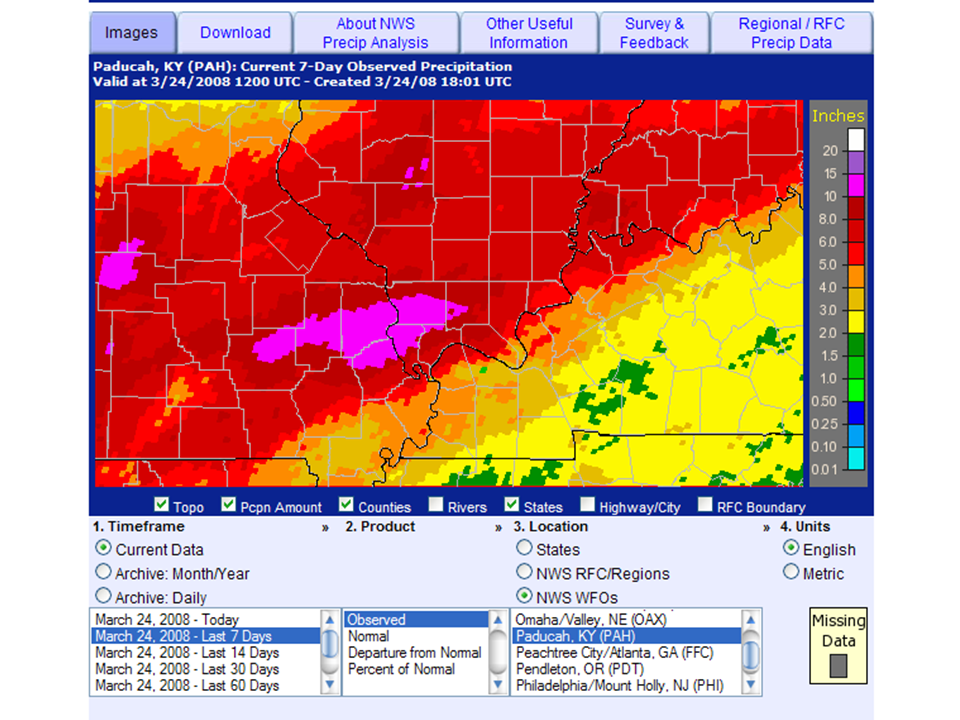 Figure 1. Radar-estimated precipitation totals for southern Illinois.
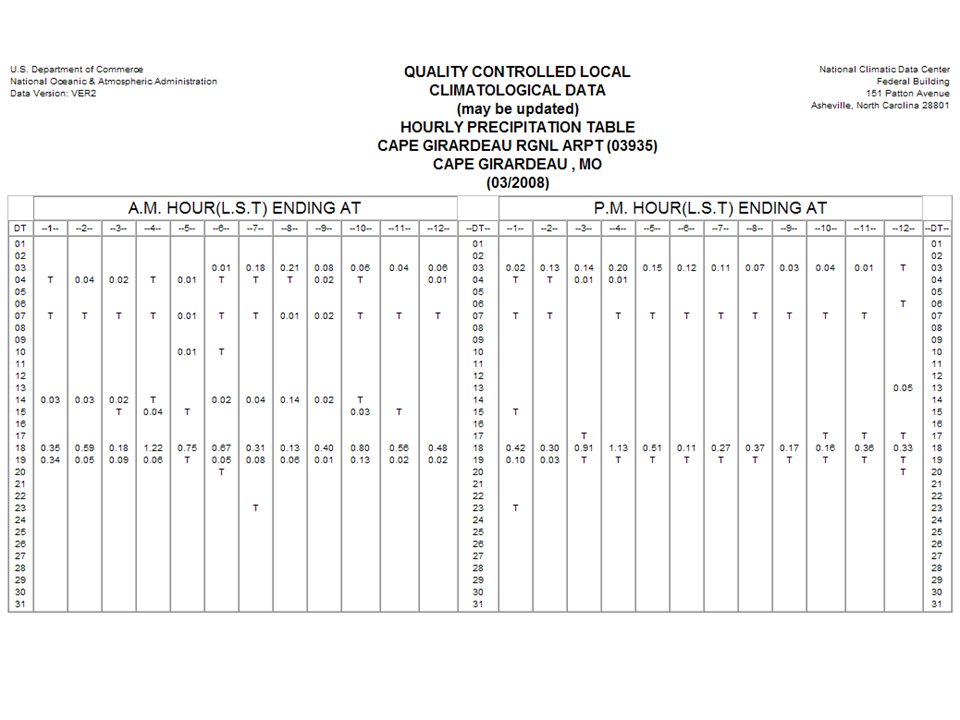 Figure 2. Hourly precipitation amounts from Cape Girardeau, MO.
Link to interesting before and after satellite pictures for southern Illinois from NASA.
- Illinois State Water Survey
- All files and information ©2008
- Last Modified: March 6, 2008