|
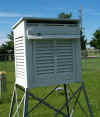
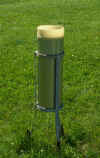
 Picture of the State Water Survey cooperative weather observation site near the corner of First and Windsor streets in Champaign Illinois.
The coordinates are 40 5' 3", -88 14' 26".
Picture of the State Water Survey cooperative weather observation site near the corner of First and Windsor streets in Champaign Illinois.
The coordinates are 40 5' 3", -88 14' 26".
|
|
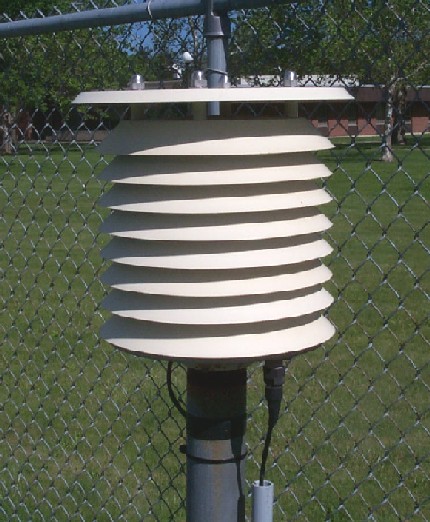
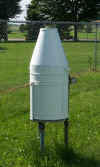
 Electronic Maximum-Minimum Temperature Sensor (MMTS) - an electronic temperature sensor that has largely replaced liquid-in-glass thermometers.
It is housed in a white case to reflect sunlight and has vents all around so that the air flows freely over the temperature sensor inside.
The idea is to measure the temperature in the shade, away from any direct effect of the sun.
Electronic Maximum-Minimum Temperature Sensor (MMTS) - an electronic temperature sensor that has largely replaced liquid-in-glass thermometers.
It is housed in a white case to reflect sunlight and has vents all around so that the air flows freely over the temperature sensor inside.
The idea is to measure the temperature in the shade, away from any direct effect of the sun.
|
|
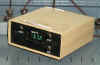 MMTS Digital Readout (housed inside) - allows the observer to read the temperatures from inside.
A newer version records hourly temperatures as well as the exact time of the high and low temperature for the day.
MMTS Digital Readout (housed inside) - allows the observer to read the temperatures from inside.
A newer version records hourly temperatures as well as the exact time of the high and low temperature for the day.
|
|
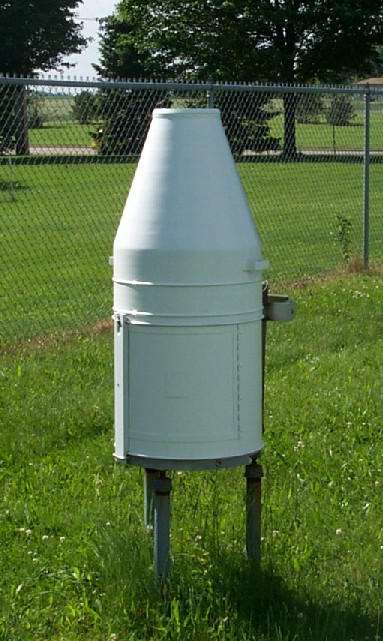
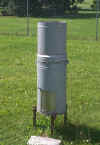
 Cotton Region Shelter (CRS) - used to house the liquid-in-glass thermometers.
It is painted white to reflect sunlight and has vents on all four sides for improved ventilation.
Both the liquid-in-glass thermometers and this type of shelter are being phased out, replaced by the MMTS.
Cotton Region Shelter (CRS) - used to house the liquid-in-glass thermometers.
It is painted white to reflect sunlight and has vents on all four sides for improved ventilation.
Both the liquid-in-glass thermometers and this type of shelter are being phased out, replaced by the MMTS.
|
|
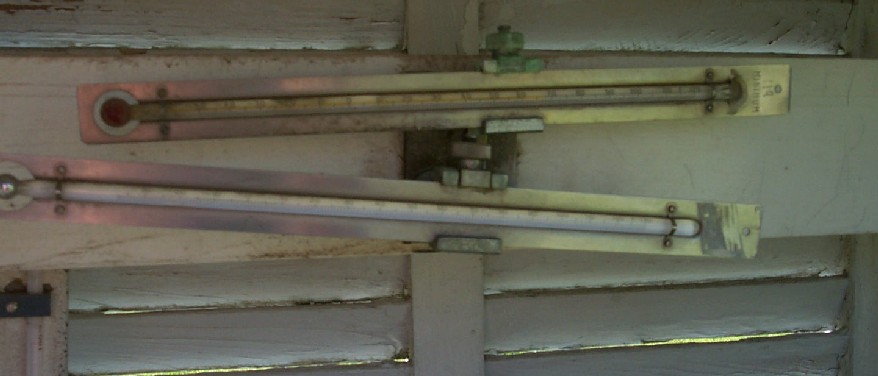
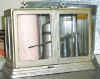
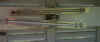 Liquid-in-glass thermometers - used to measure the high and low temperature for the day.
The design has been in use since the late 1800s.
Now replaced by the electronic MMTS system.
Liquid-in-glass thermometers - used to measure the high and low temperature for the day.
The design has been in use since the late 1800s.
Now replaced by the electronic MMTS system.
|
|
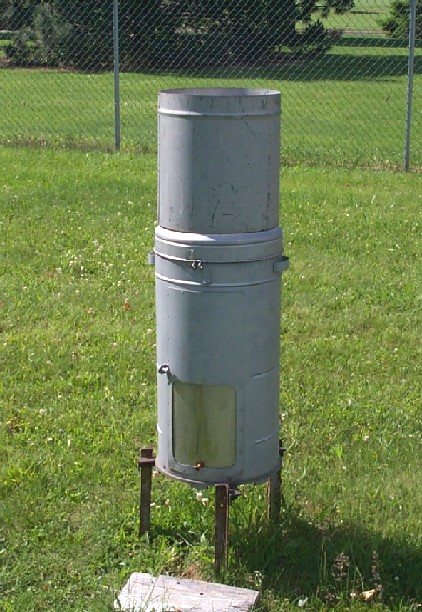
 Hygrothermograph - another way to measure temperature, this instrument provides a continuous trace of temperature on paper.
It also records relative humidity.
It has been largely replaced by electronic sensors connected to digital data loggers.
Hygrothermograph - another way to measure temperature, this instrument provides a continuous trace of temperature on paper.
It also records relative humidity.
It has been largely replaced by electronic sensors connected to digital data loggers.
|
|
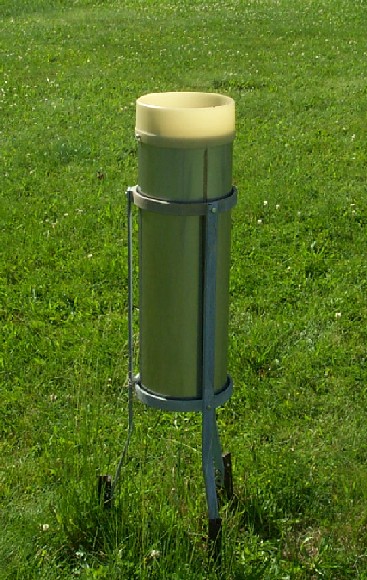
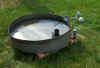
 Standard 8-inch Raingage (SRG) - used for measuring precipitation, simply insert the measuring stick and record the amount.
Dump the water out of the can and you are ready for the next storm.
Measures precipitation to the nearest 100th of an inch (0.01 inches).
Still the primary raingage of the NWS because of its simplicity and reliability (no moving parts and needs no electricity).
Standard 8-inch Raingage (SRG) - used for measuring precipitation, simply insert the measuring stick and record the amount.
Dump the water out of the can and you are ready for the next storm.
Measures precipitation to the nearest 100th of an inch (0.01 inches).
Still the primary raingage of the NWS because of its simplicity and reliability (no moving parts and needs no electricity). |
|
 Fisher-Porter Recording Raingage - this instrument records precipitation at 15-minute intervals to the nearest 10th
of an inch (0.1 inches).
It is not as widely used as the standard 8-inch raingage (SRG).
Introduced in the 1970s, it uses a cumbersome and obsolete paper-tape recording system.
It is slated to be upgraded to a more modern electronic data logging system soon.
Fisher-Porter Recording Raingage - this instrument records precipitation at 15-minute intervals to the nearest 10th
of an inch (0.1 inches).
It is not as widely used as the standard 8-inch raingage (SRG).
Introduced in the 1970s, it uses a cumbersome and obsolete paper-tape recording system.
It is slated to be upgraded to a more modern electronic data logging system soon.
|
|
 Weighing Bucket Raingage - another way of measure precipitation on a continuous basis, this one weighs the amount
of water collected and converts it to inches.
The amount is recorded on paper, similar to the way it is done on the hygrothermograph.
Newer versions record data in digital form on data loggers.
Weighing Bucket Raingage - another way of measure precipitation on a continuous basis, this one weighs the amount
of water collected and converts it to inches.
The amount is recorded on paper, similar to the way it is done on the hygrothermograph.
Newer versions record data in digital form on data loggers.
|
|
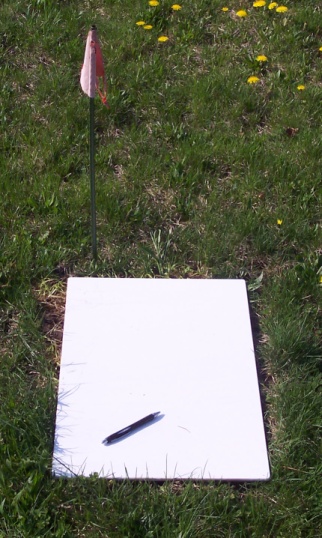
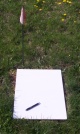 Snow Board - used to measure snowfall.
Made of either PVC or plywood, it is white to reduce solar heating.
This provides a nice, even surface for measuring snow.
A flag is planted on one corner so that the board can be found after it has snowed.
Snow Board - used to measure snowfall.
Made of either PVC or plywood, it is white to reduce solar heating.
This provides a nice, even surface for measuring snow.
A flag is planted on one corner so that the board can be found after it has snowed.
|
|
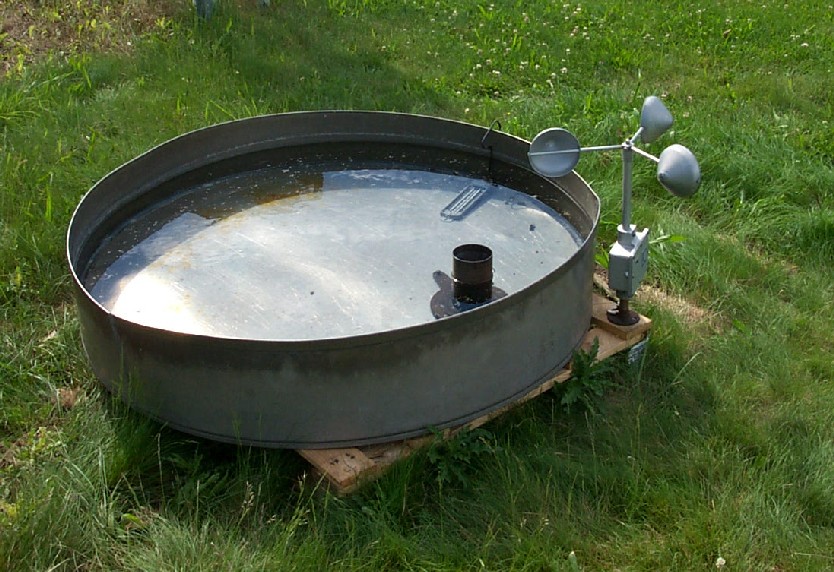
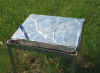
 Pan Evaporation - used to
measure water loss of open water bodies to evaporation during the warmer months.
Simply measure the drop in the water level each day, taking into account any precipitation from the nearby raingage.
Water temperatures and wind speed are recorded as well.
Check out the pan evaporation rates for sites in Illinois.
Pan Evaporation - used to
measure water loss of open water bodies to evaporation during the warmer months.
Simply measure the drop in the water level each day, taking into account any precipitation from the nearby raingage.
Water temperatures and wind speed are recorded as well.
Check out the pan evaporation rates for sites in Illinois.
|
|
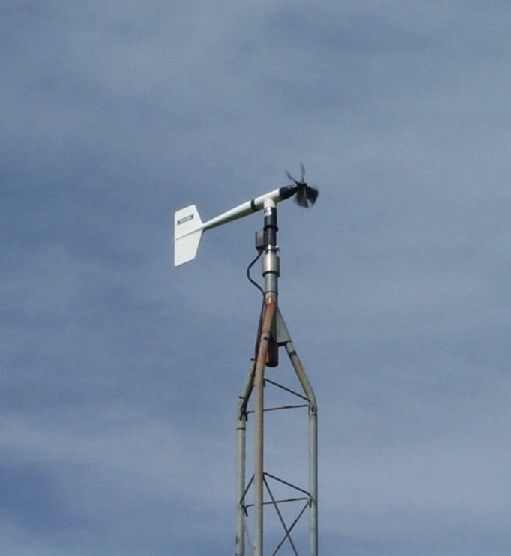
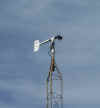 Anemometer - used to measure wind speed and direction.
The wind speed is measured by the propeller. The stronger the wind, the faster the propeller turns.
The tail points the instrument into the wind so that we can measure wind direction.
The instrument is mounted on a 10-meter (33-foot) tower to minimize the effects of nearby trees and buildings.
Anemometer - used to measure wind speed and direction.
The wind speed is measured by the propeller. The stronger the wind, the faster the propeller turns.
The tail points the instrument into the wind so that we can measure wind direction.
The instrument is mounted on a 10-meter (33-foot) tower to minimize the effects of nearby trees and buildings.
|
|
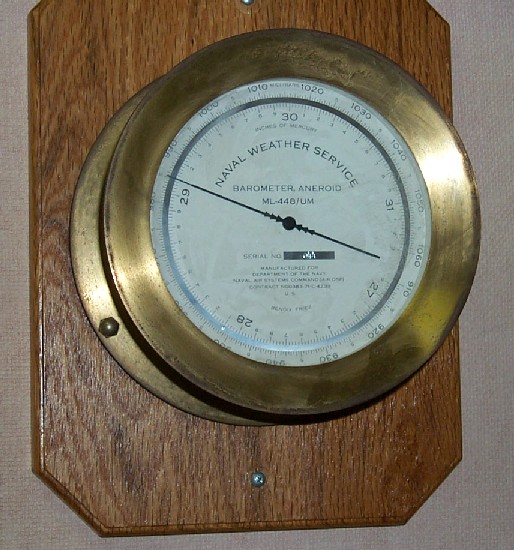
 Barometer - used to measure the air pressure.
In general, rising air pressure indicates fair weather while falling pressure indicates foul weather.
Like many instruments, this one has been largely replaced by electronic sensors.
Barometer - used to measure the air pressure.
In general, rising air pressure indicates fair weather while falling pressure indicates foul weather.
Like many instruments, this one has been largely replaced by electronic sensors.
|
|
 Microbarograph - used to measure air pressure on a continuous basis, this instrument can record small changes in pressure on paper.
This instrument has been largely replaced by electronic sensors.
Microbarograph - used to measure air pressure on a continuous basis, this instrument can record small changes in pressure on paper.
This instrument has been largely replaced by electronic sensors.
|
|
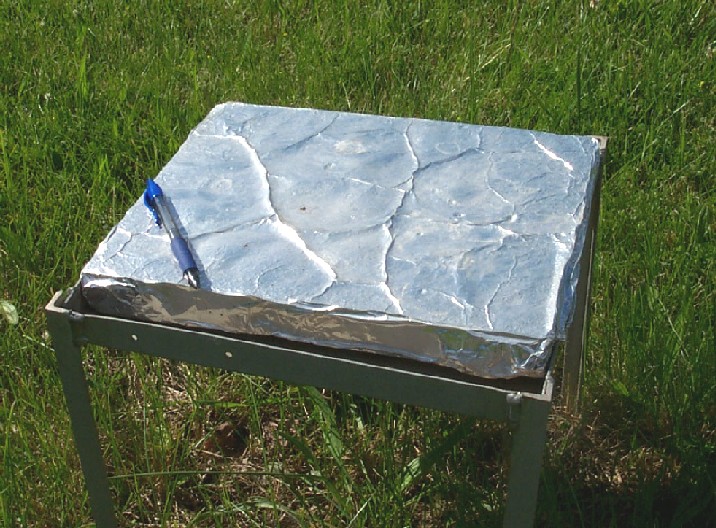
 Hail Pad - used to measure hail. Constructed using florists foam and aluminum foil.
Hail usually last for only a few minutes so this device can record hail occurrence and size even if the observer is not present.
If you look closely on the larger image, you can see the dimples in the foil caused by hail.
Hail Pad - used to measure hail. Constructed using florists foam and aluminum foil.
Hail usually last for only a few minutes so this device can record hail occurrence and size even if the observer is not present.
If you look closely on the larger image, you can see the dimples in the foil caused by hail.
|
|
Once a day, an observer goes out to record the observations and
checks the instruments to make sure they are functioning properly.
The observations are recorded on forms and are sent to the
National Climatic Data Center to be checked for mistakes, archived,
and distributed in printed publications or on their web site.
Weather observations are in a period of transition away from paper
records to storing and transmitting the data electronically. In 2008,
the observations are being reported on a web site with built-in quality control,
report generation, and data archiving.
The weather records can be used in court cases (was it raining at the
time of the accident?), by farmers (how much rain did we get?), by
schools (how much snow did we get?), and by researchers (can we see
global warming in Illinois?).
|