Water Survey Archived Content

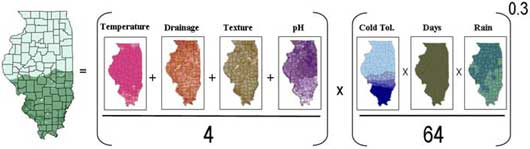
  Methods
Crop success depends on many things including abiotic, biotic and economic conditions. Suitability is a relative measure of a location’s ability to meet a crop’s abiotic environmental requirements. Suitability scores were assigned to 2,442 unique physiographic areas in Illinois to demonstrate how well selected crop requirements are met by an area's climate and soils. The term "overall suitability" refers to a combined measure of the seven selected component factors. Both overall and component suitability maps may be viewed to better understand a crop’s range.

An appraisal of crop value should include the abiotic, biotic, and economic factors that determine profitability. Considering a crop’s suitability to basic climate and soil traits is an important initial step in identifying potential new crops. The factors used in creating these suitability maps, along with examples of other factors that are not used in the model, are shown in the table below.

Crop Performance = Abiotic Factors + Biotic Factors + Economic Factors

Factors affecting crop performance and suitability

Abiotic (climate + soils)

Biotic (pathogens + parasites + beneficial organisms + genetic variation)

Economic (market + political + cultural)


Climate

Soil


Annual precipitation*
Growing days*
Daily air temperatures*
Winter minimum
     temperature*
Texture*
Drainage*
pH*
Beneficial and harmful organisms such as insects, fungi and bacteria.

Genetic variation within a crop.

Supply, demand, seed supply laws, government policy and social acceptance. 

Solar intensity
Light duration
Daily precipitation
Soil temperature
Depth
Cation Exchange
     Capacity
Fertility
Organic matter
*Note: Factors included in suitability model.

Climate

30-year data from 1971-2000 from 86 Illinois weather stations data interpolated to provide statewide coverage. The data were interpolated to include statewide coverage.

  • Temperature
    • Gumbel’s distribution statistic was used to calculate temperature probability distribution.
    • The 0.25 and 0.75 probability levels were used to insure that critical values would meet crop temperature requirements 3 out of 4 years.
Precipitation – Annual average

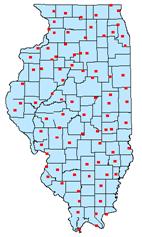
Illinois climate was estimated using 30-year air temperature and precipitation data from 86 stations distributed throughout the state (see figure). The 0.25 and 0.75 probability levels were used for daily temperatures (minimum and maximum) values to reduce the expected risk to one year in four. Had the average (0.50 probability level) been used, the expected risk of exceeding critical levels would be one year in two.

Temperature and growing days scores were combined to describe the number of days that a crop’s temperature requirements are met. Together these two traits are more meaningful than when either is discussed alone. Growth habit is also of interest. The growing season length for a winter annual crop often includes the winter dormancy period. Perennial crops live several years, but typically their reported growing seasons do not include overwintering or resting periods. For these reasons growing days, temperature, and growth habit were considered in calculating growing days and temperature scores.

Suitability maps for all four-climate requirements were constructed by assigning scores to the 86 weather stations and interpolating to provide statewide coverage. 

Annual Precipitation
Crop precipitation requirements are often reported as a yearly range. Therefore station precipitation data were summarized as an annual average. Scores were assigned by comparing the crop’s minimum and maximum requirements to an area’s annual precipitation. It was assumed that irrigation of up to 350 millimeters (mm, 14 inches) per year was available. Suitability scores for crop areas requiring irrigation were lower than for areas with sufficient natural rainfall to meet a crop’s requirement.

Growing Days
Growing days suitability maps were based on the reported minimum and maximum number of required days that temperature requirements were met. Stations were assigned growing days scores based on the number of days that crop temperature requirements were met. Growing days suitability scores were constructed for crops with unknown temperature requirements, using the frost-free period. However, temperature suitability maps and overall suitability maps were not created for these crops.

Daily Air Temperature
Absolute and optimum (minimum and maximum) temperature requirements were compared to weather station minimum and maximum temperatures. Temperature suitability maps were created for each unique temperature, growing days, growth habit combination. Temperatures associated with the 0.25 (minimum temperature) and 0.75 (maximum temperature) probability levels were used for comparison so that favorable temperatures would be expected in three out of four years.  Each day in the growing season was assigned a daily suitability value by comparing estimated hourly temperatures to the absolute and optimum temperature requirements. Daily suitability values were averaged to estimate the overall suitability scores for the growing season.

Winter Minimum Temperature or Cold Tolerance
Stations were assigned scores for overwintering crops (perennials, biennials, and winter annuals). Weather station minimum temperatures (0.25 probability level) were compared to crop requirements. Crops with minimum temperature thresholds equal to or above an area’s winter minimum temperature were considered suited to the area. Areas were assigned one of five suitability scores, from unsuitable (0) to highly suitable (4). Areas with minimum annual temperatures below the crop’s requirement were considered unsuitable. Areas with higher winter minimum temperature requirements were assigned progressively higher suitability scores in increasing 1.8 degree Fahrenheit (1 degree Celsius) gradations. Non over wintering crops were considered to be highly suited to winter minimum temperature throughout the state.        

Soil
Illinois soil information was obtained from the Natural Resources Conservation Service STATSGO database. Soil suitability scores were developed using individual crop requirements. Soil suitability was mapped by relating suitability scores to map units defined by the STATSGO database.

The STATSGO Natural Resource Conservation Service Soil database includes 82 geographic map units containing up to 21 unique soil series:
    •    Soil drainage (Weighted average for each map unit)
    •    Soil texture (Surface layer weighted average)
    •    Soil pH (Surface layer weighted average)


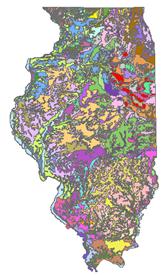
Soil map units (see figure) are the most detailed Illinois soil descriptions available for geographic information systems. These soil map units are composed of up to 21 soil types. Because the STATSGO database provides soil characteristics at the map unit level, soil component data were averaged to estimate mean map unit soil characteristics. Soil pH, texture, and drainage average values were calculated by weighting individual component values by the fraction of the map unit occupied by the soil. Surface layer values were used to characterize pH and texture. These values were then compared to crop requirements.

Soil Texture
Crops were assigned to one of 22 soil texture classifications based on the comparison of crop requirement and the weighted average percentage of sand and clay in each map unit. Disturbed soils, urban soils, extremely high organic matter soils, and soils containing a large amount (>8.7%) of coarse fragments were not included in the map unit average as these soils are not typically farmed.

Soil Drainage
Crops were assigned to soil drainage classifications using the NRCS drainage classes. Suitability classifications allowed for improvement by mechanical drainage (tiling).

Soil pH
Crops were assigned to one of 30 possible pH classifications. The mean and range of the crop’s reported pH requirement were considered. 

Scores and Maps
Component suitability scores for daily temperatures, soil drainage, soil texture, soil pH, winter minimum temperature tolerance (cold tolerance), growing days, and precipitation requirements were assigned based on crop requirements and the climate and soils of the area. A mathematical model combined component suitability value into an overall suitability score. If winter minimum temperature, growing days, or precipitation were unsuitable for an area, the area was considered to be unsuited, regardless of the other component suitability scores. Darker colors indicate greater suitability; lighter colors lesser suitability. In the equation depicted in the figure below the 4 in the denominator is used to compute the average of the daily temperature, soil drainage, soil texture, and soil pH scores resulting in a value with a range from 0 to 4. The 64 in the denominator of the second component on the right hand side of the equation scales the product of cold tolerance, growing days, and precipitation requirements to a range of 0 to 1, and the exponent (0.3) reduces the effect of the law of the minimum on the overall suitability unless one of the three variables is equal to zero. The law of the minimum states that the lowest suitability score limits the overall suitability.  The effects of the law of the minimum is shown below in the computations of the overall suitability for winter barley. The winter minimum temperature makes the northern one-half of the state unsuitable for winter barley.


Maps were created using SURFER and Environmental Systems Research Institute, Inc. Geographic Information System software. Overall suitability was determined for the 2442 unique polygons defined by soil map units and county boundaries. Mean overall suitability also was calculated for each county. More than 700 component maps were created. Overall suitability maps were generated for over 400 crops, and one or more of the components apply to more than 830 crops.

Disease
Disease susceptibility was appraised for ten common fungal plant pathogens. The ten pathogens were Erysiphe (Powdery mildew), Phytophthora, Rhizoctonia solani, Sclerotinia sclerotiorum, Pythium, Cercospora, Puccinina (Rust), Colletotrichum (Anthracnose), Cephalosporium (Cankers), and Helminthosporium/Bipolaris. This information provided by Wayne Pedersen of the University of Illinois, Department of Crop Sciences.

Taxonomy
World Economic Crops (Wiersma and Leon 1999) was used as the primary taxonomy authority and as a resource for economic use and geographical origin.  The United States Department of Agriculture Agricultural Research Service’s GRIN Taxonomy Home Page, provides additional taxonomic resources.


| Alternative Crops Home | General Information | Methods | Quick Guide | Select Crop |
| Map Search | Crop List | County Search | Disclaimer | Citations | Site Map |

| Home | Staff Directory | Data | Research |
 
University of Illinois at Urbana-Champaign logo Illinois State Water Survey, Contact Information
University of Illinois at Urbana-Champaign
All files and information © 2024 Illinois State Water Survey. Terms of use.
Email the Web Administrator with questions or comments.
Last Modified: March 15, 2021


Illinois State Water Survey illinois state Water survey Alternative Crop Suitability Maps Site Map Alternative Crop Suitability Maps Contact Information Illinois Department of Natural Resources Alternative Crop Suitability Maps